
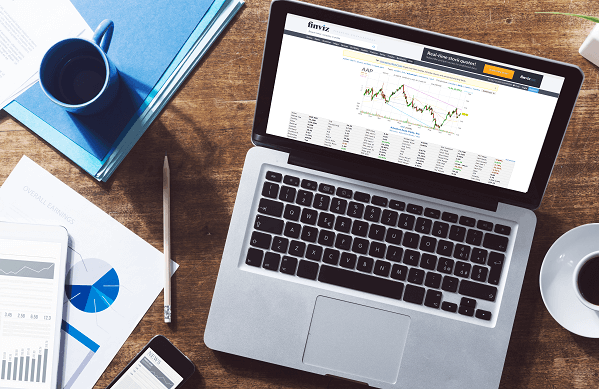
If you’ve spent any time researching stocks online, there’s a good chance you’ve come across Finviz either through a screenshot of its colorful market heatmap, or as the tool a finance YouTuber pulls up during their pre-market routine. Finviz has been around since 2007, which in internet years makes it something of a veteran, and nearly two decades of refinement have made it one of the most widely used stock screening tools available, especially among retail traders.
This review breaks down what Finviz actually offers, how the free and paid tiers differ, what its core features are genuinely good at, and where it falls short so you can decide whether it fits your own approach to researching and tracking stocks.
What Finviz Actually Is
At its core, Finviz is a web-based stock screener and market visualization tool. Its main purpose is helping traders and investors filter through the entire US stock market using specific criteria price, volume, valuation ratios, technical indicators, and dozens of other filters to narrow down a huge universe of stocks into a manageable, relevant list.
Beyond screening, Finviz has built a reputation around its visual tools, particularly its signature market heatmap, which displays sector and stock performance as a color-coded grid, making it easy to get an at-a-glance sense of what’s moving in the market and why. This combination of a powerful screener with genuinely useful visualizations is a big part of why it’s remained a go-to starting point for so many traders’ daily research routines.
It’s worth being clear about what Finviz is not: it’s not a trading platform. You can’t place trades or route orders through it. It’s a research and screening tool meant to sit alongside your actual brokerage account, not replace it.
The Stock and ETF Screener: Where Finviz Earns Its Reputation
The screener is the feature Finviz is most known for, and it’s genuinely the reason most people start using the platform. It offers more than 60 filters covering price, float, volume, short interest, gap percentage, RSI, moving average relationships, candlestick patterns, and a long list of fundamental metrics like valuation ratios and earnings data.
What makes this particularly notable is that nearly the entire filter set is available on the free tier, without even requiring an account. This is unusually generous compared to many competing tools that lock basic filtering behind a paywall, and it’s a major reason Finviz remains many traders’ first stop even before they consider paying for anything.
Beyond individual stock screening, Finviz also tracks correlated movement between related stocks useful for equity-focused sessions where a leading company’s sharp move often causes correlated stocks to follow as the broader trade rotates, something that’s genuinely useful to see without having to research those relationships manually each time.
Insider Trading Data and Market Context Tools
Another standout feature is Finviz’s insider trading tracker, which pulls data directly from SEC filings and lets you filter by transaction type, insider role, and time period. For traders who like to factor insider buying and selling activity into their research, having this pulled directly from official filings and presented in a filterable, easy-to-scan format is a meaningful convenience compared to digging through raw SEC filings yourself.
Beyond individual stocks, Finviz also covers more than 30 forex pairs, major cryptocurrency markets, and CME futures, all accessible from the same dashboard meaning you don’t necessarily need to switch tools if your research spans beyond just US equities into these adjacent markets.
The Heatmaps and Visual Tools
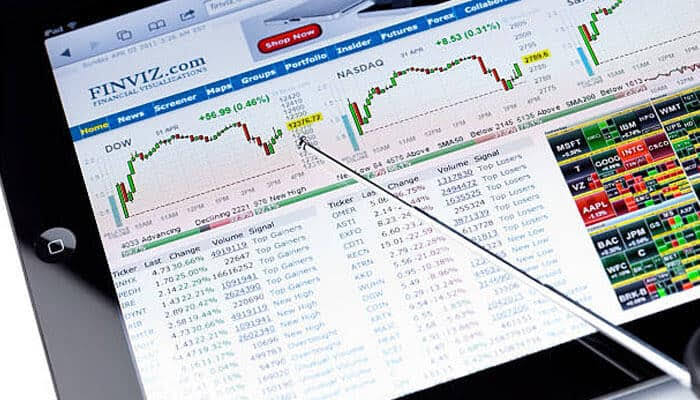
Finviz’s sector and S&P 500 heatmaps remain one of its most recognizable features, and for good reason they provide a genuinely fast way to visualize market sentiment across sectors without digging through individual numbers. This kind of at-a-glance market context is exactly the sort of thing that’s hard to replicate quickly with a plain list of numbers or a spreadsheet, and it’s a big part of why Finviz screenshots circulate so widely across trading forums and social media.
Charting Capabilities: Decent, But Not the Main Draw
Finviz includes intraday charts ranging from 1-minute to daily timeframes, with standard technical indicator overlays like moving averages, Bollinger Bands, MACD, and RSI, along with drawing tools for trend lines, support and resistance levels, and Fibonacci retracements. It also includes automatic chart pattern recognition, flagging common formations like head-and-shoulders patterns, triangles, and wedges.
That said, most reviews are consistent in describing the charting tools as solid and serviceable rather than best-in-class. If detailed, highly customizable charting is your primary need, dedicated charting platforms tend to offer more depth. Finviz’s charts are genuinely useful for a quick visual check during the screening process, but they’re not likely to replace a dedicated charting tool for traders who rely heavily on advanced technical analysis.
Free vs. Elite: What Actually Changes
Finviz runs on a fairly simple freemium model a generous free tier, and a single paid tier called Finviz Elite that unlocks the platform’s full feature set.
The free tier includes the vast majority of the screener’s filters, fundamental data, public charts, and the signature heatmaps, all without requiring an account. Creating a free registered account (just providing a name and email) unlocks the ability to save research, build and track up to 50 portfolios, store screener presets, and customize your dashboard layout genuinely useful conveniences, though live market data remains delayed (typically in the 15 to 20 minute range) even with a free account.
Finviz Elite costs $39.50 per month, or $299.50 billed annually, which works out to roughly $24.96 per month — a savings of around 35 to 37 percent compared to paying monthly. Elite unlocks real-time and pre-market quotes (a meaningful upgrade for anyone doing pre-market gap scanning), an ad-free interface, unlimited email and push alerts for price moves, news, insider activity, and SEC filings, full CSV export with API access for automation, and ETF holdings data.
New Elite subscribers typically get a short free trial period (commonly around 7 days) covering the full feature set, along with a 30-day money-back guarantee on paid subscriptions. It’s worth checking the current sign-up terms directly on Finviz’s site, since trial length and credit card requirements have reportedly varied at different points.
A Feature Worth Double-Checking: Backtesting
One area where available information genuinely conflicts is backtesting. Some recent reviews describe Elite as including a backtesting tool, letting subscribers validate screening strategies against up to 20 years of historical data, tracking metrics like average returns, win rates, and maximum drawdown. Other reviews state that Finviz’s Elite backtester was actually removed around 2023, and caution that any review still praising it as a current feature may be working from outdated information.
Given this direct disagreement between sources, the safest approach if backtesting matters to your decision is to check Finviz’s current feature list directly on their site before subscribing, rather than relying on any single review (including this one) to confirm its current availability.
Coverage: What Finviz Does and Doesn’t Include
Finviz’s coverage is strictly focused on US markets NASDAQ, NYSE, and AMEX with no international market coverage currently offered or planned by the company. If your research spans international stocks, you’ll need a separate tool for that portion of your process.
It’s also worth understanding what Finviz doesn’t try to do. It functions as a discovery and screening tool finding stocks worth a closer look rather than a portfolio tracking or accounting tool. It has watchlist-style portfolio features, but no cost-basis analytics, no multi-currency accounting, no dividend tracking dashboard, and no broader financial health scoring. Many active users pair Finviz with a separate portfolio-tracking tool specifically because Finviz is built for the “hunt” finding candidates rather than the ongoing management of positions you’ve already taken.

Mobile Access: A Real Limitation
As of recent reviews, Finviz does not have an official dedicated mobile app for iOS or Android. The website itself is mobile-responsive and functional on a smartphone browser, but reviewers consistently note that the screener, heatmaps, and multi-column data views are noticeably better suited to a larger desktop screen, where you can see more filters and data at once.
It’s also worth a specific word of caution here: reviews note the existence of third-party apps using similar names (notably one called “FINWIZ”) that are not affiliated with the official finviz.com platform, and users are advised to avoid these rather than assuming they’re an official mobile companion app.
Who Finviz Is Actually Best For
Based on its strengths and limitations, Finviz tends to work best for US equity-focused traders and investors who want a fast, filter-rich way to scan the market, build watchlists, and get quick visual market context before diving deeper elsewhere. Swing traders and active day traders benefit particularly from Elite’s real-time and pre-market data. Long-term investors who mainly need fundamental screening and don’t require real-time data can often get by comfortably on the free tier alone.
It’s less well-suited to traders needing international market coverage, those who want an all-in-one portfolio accounting and tracking solution, or anyone who wants a polished, native mobile app experience rather than a responsive but desktop-oriented website.
The Bottom Line
Finviz has earned its long-standing reputation as one of the best free stock screening tools available, and its Elite tier adds genuinely valuable upgrades particularly real-time data and unlimited alerts at a price point that remains competitive compared to many dedicated trading platforms. Its core strengths are the depth and accessibility of its screener, the usefulness of its heatmap visualizations, and its focus on US equities specifically. Its main limitations are the lack of a dedicated mobile app, no international market coverage, and some uncertainty around whether backtesting remains a current Elite feature. For US-focused traders looking for a fast, reliable research and screening tool to use alongside their actual brokerage account, Finviz remains one of the more cost-effective, well-regarded options in 2026.
FAQs
Q1: Is Finviz’s free version actually usable, or is it just a limited trial? The free tier is genuinely usable on its own — it includes the vast majority of the screener’s 60-plus filters, fundamental data, public charts, and the signature heatmaps without requiring an account. The main trade-offs are delayed market data (typically 15 to 20 minutes), ads, and a lack of real-time alerts, which Elite removes.
Q2: How much does Finviz Elite cost? Finviz Elite costs $39.50 per month, or $299.50 billed annually, which works out to roughly $24.96 per month — a savings of around 35 to 37 percent compared to monthly billing. Most new subscribers get a short free trial and a 30-day money-back guarantee, though it’s worth confirming current trial terms directly on Finviz’s site.
Q3: Does Finviz have a mobile app? No official dedicated app currently exists for iOS or Android. The website is mobile-responsive and works on smartphones, but the experience is clearly optimized for desktop use. Be cautious of unaffiliated third-party apps using similar names, which are not connected to the official platform.
Q4: Can I use Finviz to research international stocks? No. Finviz’s coverage is strictly limited to US markets — NASDAQ, NYSE, and AMEX — with no international stock coverage currently offered or planned.
Q5: Is Finviz a full trading and portfolio management platform? No. Finviz is a screening and research tool, not a trading platform — you can’t place trades through it. It also lacks deeper portfolio management features like cost-basis tracking, multi-currency accounting, or dividend tracking, so many users pair it with a separate portfolio tracker once they’ve bought into a position.