


In today’s fast-paced digital landscape, software systems are becoming increasingly complex. Modern applications are distributed, cloud-native, and rely on microservices, containers, and orchestration tools like Kubernetes. While these technologies offer scalability, flexibility, and rapid deployment, they also introduce new challenges in monitoring and understanding system behavior. This is where observability in DevOps comes into play.
Observability, at its core, is the ability to understand the internal state of a system based on the data it generates. Unlike traditional monitoring, which often focuses on predefined metrics, observability empowers DevOps teams to explore, analyze, and troubleshoot issues dynamically, providing deeper insights into system health and performance.
This article dives into the concept of observability in DevOps, its importance, key pillars, best practices, tools, challenges, and its role in shaping modern software delivery.
Understanding DevOps and Observability
What is DevOps?
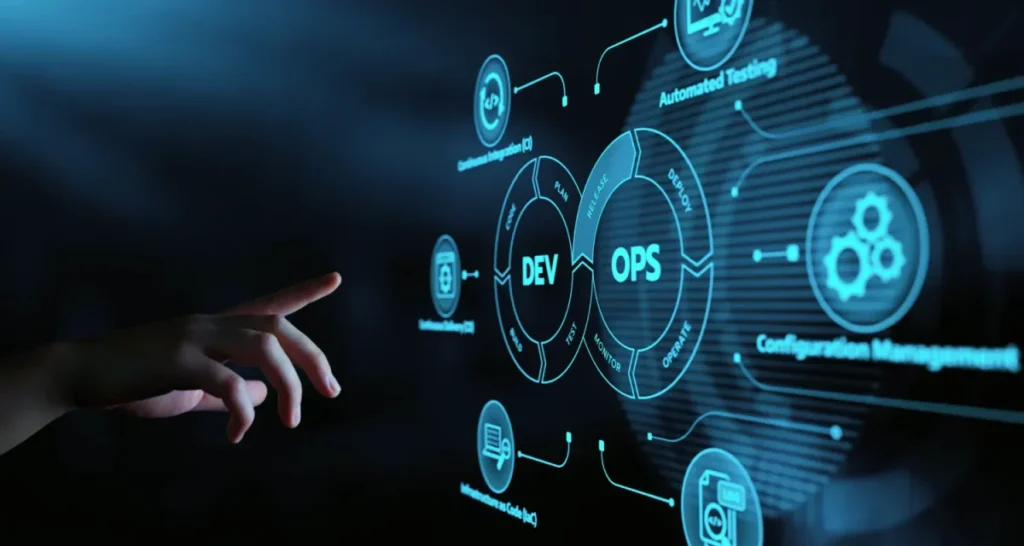
DevOps is a combination of Development (Dev) and Operations (Ops) that emphasizes collaboration, automation, and continuous delivery to achieve faster and more reliable software releases. DevOps is not just a set of tools; it is a culture that promotes:
-
Continuous Integration (CI)
-
Continuous Delivery/Deployment (CD)
-
Infrastructure as Code (IaC)
-
Collaboration between development and operations teams
In the DevOps world, speed, reliability, and resilience are critical. To achieve these goals, teams need deep visibility into their systems, which is where observability becomes essential.
What is Observability?
Observability is the measure of how well you can understand a system’s internal state from the data it produces. The term originates from control theory in engineering, where a system is considered observable if its internal states can be inferred from outputs.
In DevOps, observability allows teams to:
-
Detect anomalies in real-time
-
Troubleshoot complex issues efficiently
-
Understand the root cause of failures
-
Improve system reliability and performance
Monitoring vs Observability
While often used interchangeably, monitoring and observability are not the same:
Aspect |
Monitoring |
Observability |
|---|---|---|
Definition |
Tracks predefined metrics and alerts |
Provides insights into unknown issues through comprehensive data |
Approach |
Reactive (alerts on failures) |
Proactive (explore system behavior to detect anomalies) |
Data Sources |
Metrics |
Metrics, Logs, Traces |
Focus |
Known problems |
Unknown and complex problems |
Goal |
Alert and report |
Diagnose and understand system state |
The Three Pillars of Observability
Observability relies on three main types of telemetry data: Metrics, Logs, and Traces.
1. Metrics
Metrics are numerical data points collected over time. They provide insight into system performance, such as CPU usage, memory consumption, request latency, and error rates. Metrics are usually visualized through dashboards and graphs.
-
Example: Average response time of a web service over the last hour.
-
Use Case: Alerting when response time exceeds a certain threshold.
2. Logs
Logs are timestamped records of discrete events generated by applications, servers, or network devices. They provide context and detail about what is happening in the system.
-
Example: An error stack trace indicating why a request failed.
-
Use Case: Debugging issues after a failure occurs.
3. Traces
Traces track the journey of a single request as it travels through various services in a distributed system. They help understand latency issues and pinpoint which service or endpoint is causing delays.
-
Example: A request traveling from API Gateway → Authentication Service → Database → Response.
-
Use Case: Identifying bottlenecks in microservices architecture.
Why Observability is Critical in DevOps
Modern systems are dynamic, distributed, and often ephemeral. Observability helps DevOps teams:
-
Proactively Detect Issues: By continuously analyzing telemetry data, teams can identify performance degradation before it impacts users.
-
Accelerate Troubleshooting: Observability enables root-cause analysis without manual guesswork.
-
Improve System Reliability: Continuous insights help prevent outages and ensure higher uptime.
-
Enhance Collaboration: Shared dashboards and logs improve communication between Dev and Ops teams.
-
Support Continuous Improvement: Observability data can inform better architecture, code optimization, and deployment strategies.

Benefits of Observability in DevOps
-
Faster Incident Resolution: Reduce Mean Time to Detect (MTTD) and Mean Time to Resolve (MTTR).
-
Better Performance Tuning: Understand system behavior and optimize resource usage.
-
Enhanced User Experience: Detect and fix issues that affect end-users.
-
Data-Driven Decisions: Make informed architectural and operational choices.
-
Automation Support: Integrate with AI/ML for predictive analytics and automated remediation.
Key Observability Tools
Several tools help implement observability effectively:
1. Prometheus
An open-source monitoring and alerting toolkit designed for reliability and scalability. It primarily works with metrics and integrates seamlessly with Kubernetes.
2. Grafana
A visualization platform that supports dashboards for metrics, logs, and traces. It can integrate with multiple data sources, including Prometheus and Elasticsearch.
3. ELK Stack (Elasticsearch, Logstash, Kibana)
A robust logging solution that aggregates, analyzes, and visualizes log data. ELK is widely used for troubleshooting and operational insights.
4. Jaeger
An open-source distributed tracing tool, ideal for microservices architecture. It helps track requests across multiple services to pinpoint latency and performance issues.
5. OpenTelemetry
A vendor-neutral open-source project that standardizes telemetry collection (metrics, logs, traces) and supports various platforms and languages.
6. Datadog & New Relic
Commercial observability platforms that provide integrated metrics, logs, and traces with AI-driven analytics, alerting, and reporting features.
Observability Architecture & Best Practices
Key Components of Observability Architecture
-
Instrumentation: Embed telemetry collection into applications and infrastructure.
-
Data Collection: Gather metrics, logs, and traces from all layers.
-
Data Aggregation: Centralize data in observability platforms.
-
Visualization: Use dashboards to monitor system health.
-
Alerting: Configure alerts based on thresholds and anomalies.
-
Analysis: Perform root-cause analysis and trend detection.
Best Practices
-
Instrument all microservices for full visibility.
-
Use structured logging for easier parsing and analysis.
-
Correlate metrics, logs, and traces to uncover hidden issues.
-
Implement anomaly detection to catch issues proactively.
-
Regularly review and refine dashboards and alert rules.
-
Integrate observability into CI/CD pipelines for continuous monitoring.
Challenges in Observability
While observability is crucial, implementing it comes with challenges:
-
Data Overload: Large-scale systems generate massive amounts of telemetry data.
-
Tool Integration: Different tools may require complex configurations.
-
Cost Management: Collecting, storing, and analyzing telemetry can be expensive.
-
Skill Gap: Teams need expertise to interpret observability data effectively.
-
Cultural Adoption: DevOps teams must embrace a data-driven, proactive mindset.
Solution: Focus on strategic telemetry collection, automation, and training.
Observability in CI/CD Pipelines
Observability is not limited to production systems; it is essential in continuous integration and delivery pipelines:
-
Monitor build times, test coverage, and deployment metrics.
-
Identify failing builds or slow test cases before deployment.
-
Integrate alerting for pipeline failures to reduce downtime.
-
Collect logs from staging environments for early detection of issues.
Real-World Use Cases
1. E-commerce Platforms
-
Detecting checkout latency issues using distributed tracing.
-
Analyzing API request patterns to optimize server performance.
2. Financial Services
-
Monitoring transaction failures and security anomalies.
-
Ensuring high availability during peak trading hours.
3. SaaS Applications
-
Understanding user behavior and resource utilization.
-
Predicting potential system failures before affecting end-users.
Future of Observability
Observability is evolving rapidly:
-
AI & Machine Learning Integration: Predictive analytics and automated remediation.
-
Serverless & Edge Computing Observability: New telemetry models for ephemeral environments.
-
Unified Observability Platforms: Integration of metrics, logs, traces, and user experience monitoring.
-
Standardization & OpenTelemetry Adoption: Easier cross-platform observability.
The future promises more intelligent, proactive, and automated observability that empowers DevOps teams to maintain resilient, high-performing systems.
Conclusion
Observability in DevOps is no longer optional; it is a strategic necessity. As applications grow in complexity, traditional monitoring is insufficient. DevOps teams require deep insights into metrics, logs, and traces to maintain reliability, performance, and user satisfaction.
By implementing best practices, leveraging modern tools like Prometheus, Grafana, ELK, Jaeger, and OpenTelemetry, and fostering a culture of observability, organizations can detect problems faster, troubleshoot efficiently, and continuously improve their systems.
Ultimately, observability bridges the gap between system complexity and operational clarity, enabling businesses to deliver high-quality, resilient software in the era of cloud-native and microservices architectures.
Frequently Asked Questions (FAQ) – Observability in DevOps
1. What is observability in DevOps?
Observability is the ability to understand the internal state of a system by analyzing the data it produces, such as metrics, logs, and traces. It helps DevOps teams proactively detect, diagnose, and resolve issues in complex distributed systems.
2. How is observability different from monitoring?
Monitoring tracks predefined metrics and alerts teams about known issues, while observability provides deep insights into unknown issues, allowing teams to explore and analyze system behavior to identify the root cause.
3. What are the main pillars of observability?
The three core pillars are:
-
Metrics: Numerical measurements like CPU usage, memory consumption, and request latency.
-
Logs: Timestamped records of events or errors that provide context.
-
Traces: End-to-end tracking of requests across distributed services to identify latency and bottlenecks.
4. Why is observability important in DevOps?
Observability helps improve system reliability, accelerate incident resolution, optimize performance, and enable data-driven decisions. It allows DevOps teams to manage complex, distributed systems effectively.
5. What are the popular observability tools?
Some widely used tools include:
-
Prometheus – Metrics collection and alerting
-
Grafana – Visualization and dashboards
-
ELK Stack (Elasticsearch, Logstash, Kibana) – Logging and analysis
-
Jaeger – Distributed tracing
-
OpenTelemetry – Standardized collection of metrics, logs, and traces
-
Datadog, New Relic – Integrated commercial observability platforms
6. Can observability help in CI/CD pipelines?
Yes! Observability in CI/CD helps monitor build times, test coverage, and deployment metrics. It allows teams to detect pipeline failures early, reducing downtime and improving release quality.
7. What are the challenges of implementing observability?
Challenges include data overload, tool integration complexity, high costs, skill gaps, and cultural adoption. Effective strategies include structured telemetry collection, automation, and team training.
8. How does observability support microservices?
In microservices architectures, observability provides end-to-end visibility across multiple services, helping teams identify which service is causing issues, trace request flow, and optimize performance.
9. Is observability only for large enterprises?
No. Observability benefits organizations of all sizes, from startups to large enterprises, by providing insights that help maintain performance, reliability, and scalability.
10. What is the future of observability in DevOps?
The future includes AI/ML-driven predictive analytics, automated remediation, observability for serverless and edge computing, unified platforms, and broader adoption of standards like OpenTelemetry.