


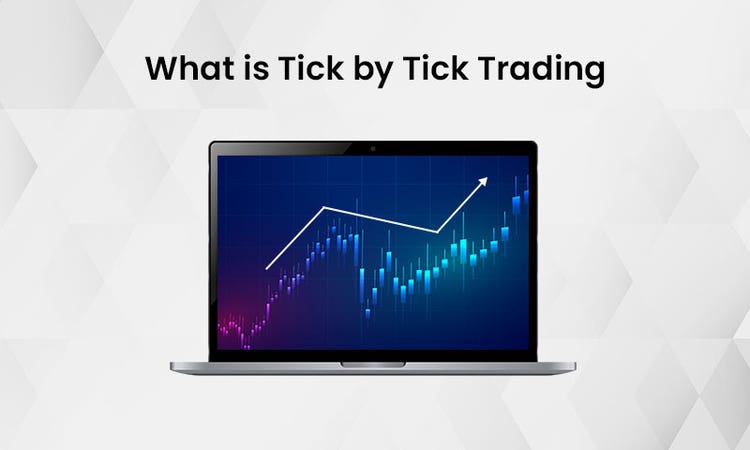
Financial markets move constantly, with prices shifting every second. Whether you’re trading stocks, cryptocurrencies, forex pairs, or commodities, even the tiniest price change can reveal a lot about what’s going on.At the heart of measuring these shifts is the Trading Tick.If you’re new to trading or have some experience, understanding ticks is pretty crucial. A tick shows the smallest possible change in the price of a trading instrument. Watching how ticks move helps traders keep an eye on market activity, gauge momentum, and make smarter calls.Here’s a closer look at what Trading Ticks are, how they work, why they matter, and how traders use tick data to sharpen their strategies.
What Is a Trading Tick?
A trading tick is the smallest possible price movement of a financial instrument in a market. It shows the minimum change in price that can happen between trades.
For example:
If a stock moves from $50.00 to $50.01, that’s one tick. If a currency pair shifts from 1.2000 to 1.2001, that also counts as a tick.Ticks matter because they reveal how often prices change and how active a market is at any given time.
Why Trading Ticks Are Important
Ticks offer a glimpse into market activity. Traders watch tick movements closely to see if buyers or sellers have the upper hand.
Here’s why ticks really matter:
They help measure market activity. They reveal short-term price changes.Ticks also shed light on liquidity levels. And they help track trading momentum.For high-frequency traders and scalpers, tick data is especially valuable.
How Tick Size Works
Tick size is the smallest price change allowed for a trading instrument.
For example:
A stock might move in steps of $0.01. A futures contract could have a tick size of $0.25. A forex pair often shifts by 0.0001 increments.Exchanges or trading platforms usually set the tick size for each asset.
Types of Trading Ticks
Ticks can be sorted by the direction the price moves.
Uptick
An uptick happens when the latest trade price is higher than the one before it.
Example:
Previous trade: $100.00 New trade: $100.02 This shows buying pressure in the market.
Downtick
A downtick occurs when the latest trade price is lower than the previous trade price.
Example:
Previous trade: $100.00 New trade: $99.98This points to selling pressure.
Zero Tick
A zero tick happens when the latest trade price matches the previous one exactly.For example: Previous trade: $100.00 New trade: $100.00This suggests the market is temporarily stable.
Tick Charts in Trading
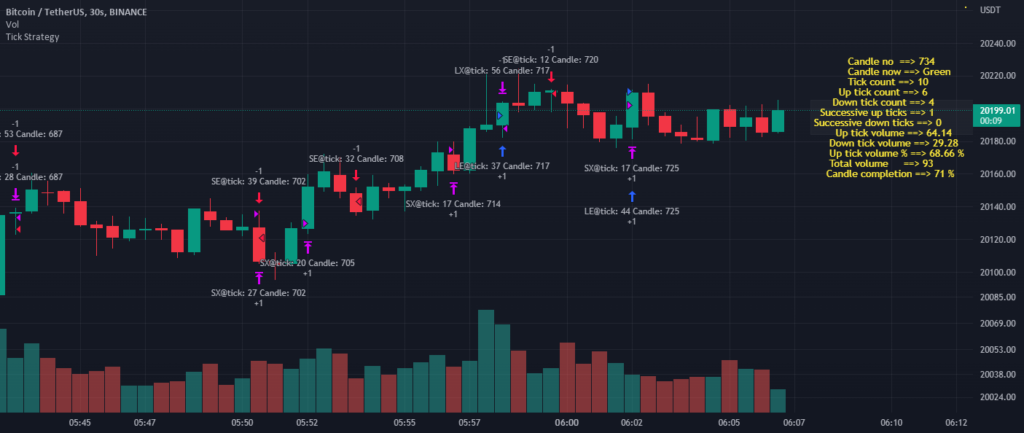
Tick charts show price movements based on the number of trades instead of time.Unlike traditional charts like 1-minute, 5-minute, or hourly charts, tick charts only update when a set number of trades happen.For example, a 100-tick chart forms a new bar after every 100 trades.This method helps traders get a clearer picture of market activity.
Benefits of Using Tick Charts
Tick charts offer several perks for active traders.Better Market Activity AnalysisThey show actual trading activity instead of just time intervals.Faster Reaction to Market ChangesBecause tick charts update with each trade, they can highlight price moves sooner than time-based charts.Improved Scalping OpportunitiesScalpers and day traders often rely on tick charts to catch small price swings.
Tick Data in High-Frequency Trading
High-frequency trading (HFT) depends a lot on tick data. These systems handle thousands of trades in mere milliseconds to spot patterns and make trades automatically.Tick data lets algorithms study tiny price shifts and order flow. It also reveals liquidity patterns.This gives trading systems an edge, letting them move quicker than any human trader could.
Trading Tick vs Pip vs Point
Many traders confuse ticks with other trading terms. Let’s clear that up.
Tick
A tick is the smallest possible price movement in a trading instrument.
Pip
This term is mostly used in forex trading. A pip usually marks the fourth decimal place in currency pairs.
Example:
EUR/USD moves from 1.2000 to 1.2001 = 1 pip.
Point
A point shows a bigger movement than a tick, but it varies depending on the market.
Scalping
Scalping means grabbing very small profits from lots of quick trades. Traders keep an eye on tick charts to spot fast price moves.
Order Flow Analysis
Tick data shows whether buyers or sellers have the upper hand. This lets traders guess where prices might head next.
Momentum Trading
Quick tick moves can signal strong momentum in the market. Traders often jump in when they sense momentum picking up.
Tools Used for Tick Analysis
Modern trading platforms come with advanced tools for tick data analysis. Popular options include tick charts, order book analysis, volume indicators, and the trade tape (time and sales data).These tools give traders a real-time peek into market behavior.
Tick Trading in Different Markets
Ticks show up in all kinds of financial markets.
Stock Market
Stocks usually move in ticks of $0.01.
Forex Market
Forex pairs change in tiny steps called pips.
Futures Market
Futures contracts have fixed tick sizes set by the exchange.For example, S&P 500 futures often move in 0.25-point increments.

Cryptocurrency Market
Crypto markets use tick sizes too, though they vary depending on the platform.
Advantages of Understanding Trading Ticks
Learning about trading ticks offers several benefits.
Better Market Timing
Tick analysis lets traders enter and exit positions with more precision.
Improved Short-Term Trading
Day traders often use tick data to spot quick opportunities.
Deeper Market Insight
Tick movements show the underlying forces of supply and demand.
Risks of Tick-Based Trading
Tick analysis can be powerful, but it has its downsides.
Market Noise
Small price swings sometimes send misleading signals.
Overtrading
Focusing too much on ticks might push traders to trade too often.
High Stress Levels
Tick-based trading demands intense focus and rapid decisions.
Tips for Beginners Learning Tick Trading
If you’re new to trading ticks, here are a few things to keep in mind.
Start with Demo Trading
Try practicing with tick charts before risking real money. It’s a safer way to get the hang of how things move.
Use Risk Management
Never skip stop-loss orders—they’re your safety net to protect your capital.
Focus on Learning Market Behavior
Watch how ticks behave in different market conditions. Getting a feel for this can really sharpen your trading instincts.
The Future of Tick-Based Trading
Financial technology keeps advancing, and tick-based trading is no exception.We might see AI-powered analysis, better algorithmic trading systems, and real-time big data analytics soon.These tools should help traders read tick movements faster and more accurately.

Conclusion
The Trading Tick is one of the most fundamental concepts in financial markets. It shows the smallest possible price movement of a trading instrument and offers valuable insight into market activity.Understanding tick size, tick charts, and tick-based strategies helps traders get a clearer picture of price movements and market behavior. Tick trading demands discipline and experience, but it can provide powerful tools for analyzing momentum and spotting trading opportunities.Whether you’re a beginner or have been trading for years, mastering trading ticks is a key step toward building successful strategies in today’s financial markets.
Frequently Asked Questions (FAQs)
1. What is a trading tick?
A trading tick is the smallest possible price movement of a financial instrument in a market. It represents the minimum change that can occur between two trades.
2. What does tick size mean in trading?
Tick size refers to the minimum price increment allowed for a specific asset. For example, if a stock has a tick size of $0.01, its price can only move in increments of one cent.
3. How are trading ticks used by traders?
Traders use tick data to analyze market activity, track price movements, and identify buying or selling pressure in real time.
4. What is the difference between a tick and a pip?
A tick is the smallest price movement in any financial market, while a pip is a specific unit used mainly in forex trading to measure currency price changes.
5. What are tick charts in trading?
Tick charts are charts that display price movements based on a specific number of trades instead of time intervals. A new bar appears after a certain number of transactions occur.
6. Why do day traders use tick charts?
Day traders use tick charts because they reflect real trading activity and help identify short-term price movements and momentum more quickly than time-based charts.
7. Can beginners use tick trading strategies?
Yes, beginners can learn tick trading, but it requires practice and a good understanding of market behavior. Many traders start with demo accounts before trading with real money.
8. Do all markets use ticks?
Yes, most financial markets such as stocks, forex, futures, and cryptocurrencies use tick movements to measure price changes.
9. What are the advantages of tick-based trading?
Tick-based trading helps traders understand market momentum, analyze order flow, and identify short-term trading opportunities.
10. What are the risks of trading using ticks?
Tick trading can involve high volatility and rapid price movements, which may lead to quick losses if traders do not manage risk properly.